


The index is the geometric mean of each product's local price relative to the US price, converted at market exchange rates. Western Europe forms a solid block above the United States: Switzerland at 127, Denmark at 118, the United Kingdom at 114, Norway at 111, and the euro countries between 106 and 110.
Part of that is tax: European prices include VAT of 17 to 27 percent, while US prices are shown before sales tax. Part of it is the weak dollar of late 2026. And part of it is simply that companies charge what each market will bear.
Below the US sit the Anglophone and Asian markets that get modest discounts (Canada 90, Japan 82, South Korea 85), then Latin America (Mexico 79, Brazil 65), and finally the four markets where digital companies price for a very different wallet: Türkiye 59, Ukraine 58, Argentina 57 and India 56.
A dollar doesn’t buy the same amount of bread in Mumbai and Zurich, so a dollar price in India is a much larger share of an Indian's spending power. Dividing each price by the World Bank's purchasing-power conversion factor turns the ranking upside down.
Türkiye tops the list at 258, followed by India (257), Romania (254), Indonesia (241) and Ukraine (227). The countries that looked expensive in dollars become the easiest places to afford a subscription: Switzerland falls to 107, Australia to 105, and the United States stays at 100.
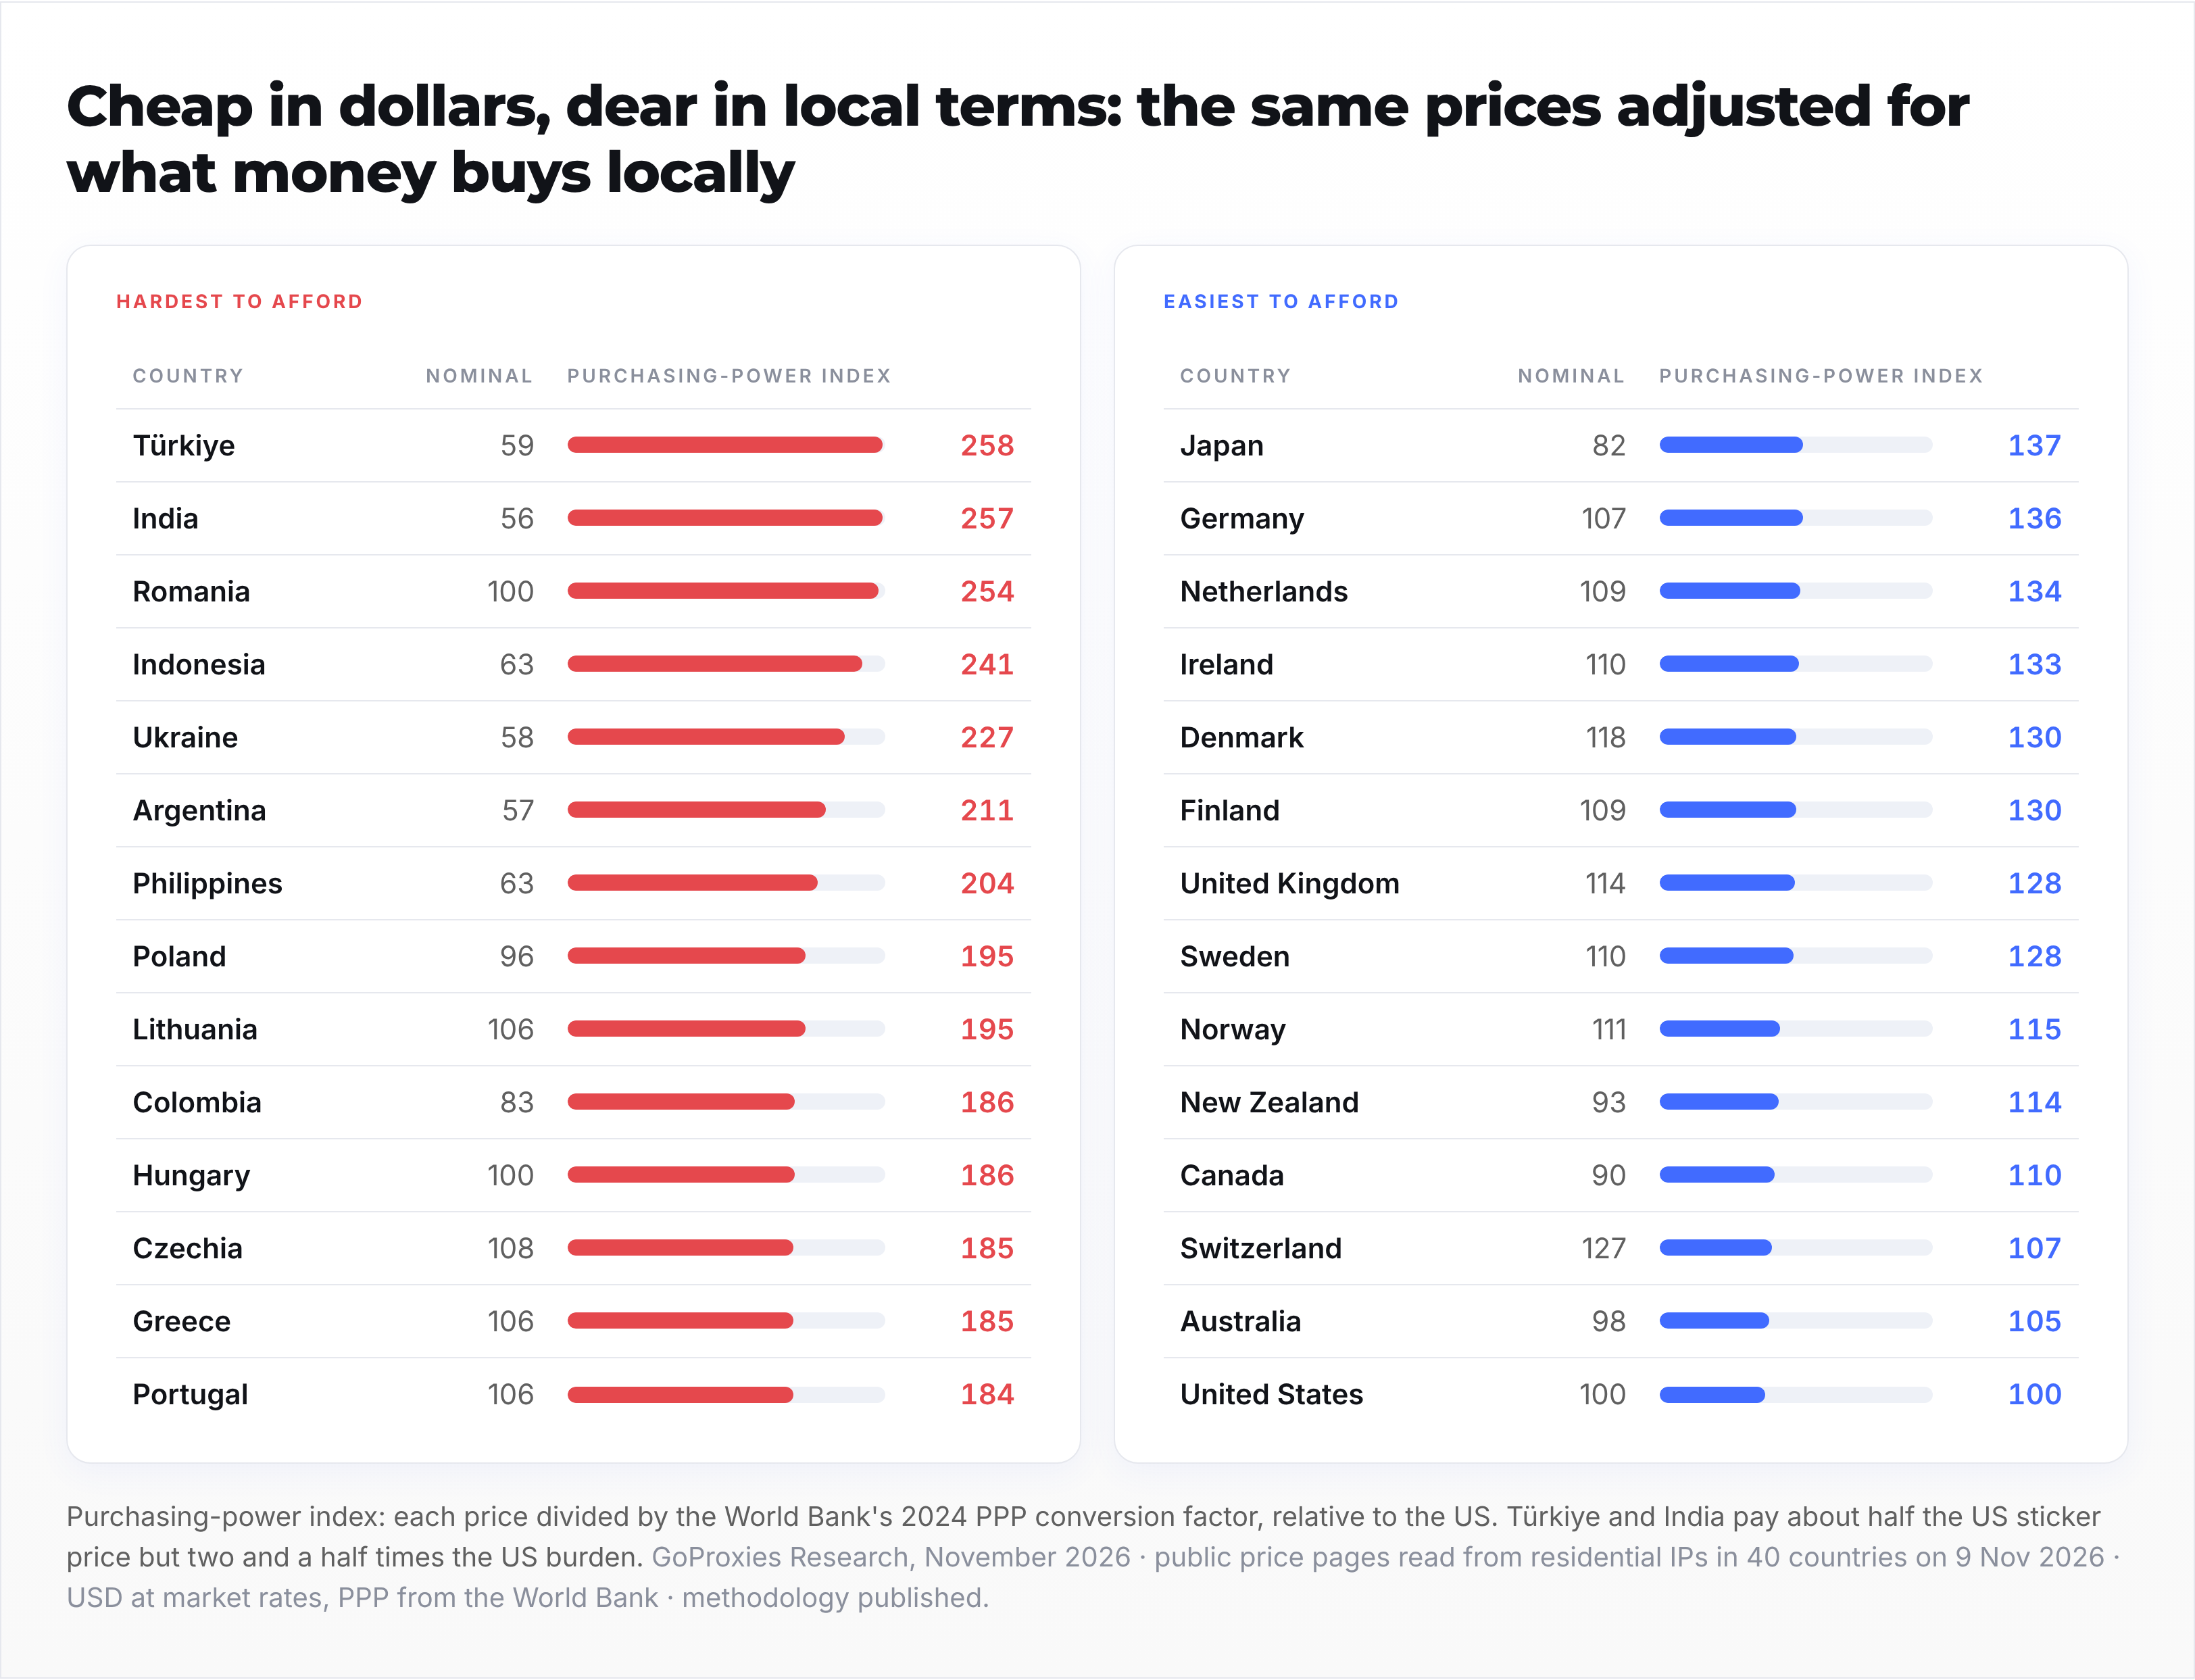
Central and Eastern Europe is the uncomfortable middle. Romania, Poland, Lithuania, Hungary and Czechia pay roughly US sticker prices, often the identical euro price as Germany, on incomes a third to a half of Germany's. Their purchasing-power index runs from 185 to 254, well above anything in Western Europe.
Not every product discriminates equally. The music and video services are tuned market by market: Deezer Premium costs $1.20 a month in Türkiye and $18.24 in Switzerland, Spotify Premium $1.48 in India and $19.46 in Switzerland, Netflix's entry plan $1.58 in India and $18.18 in Switzerland.
These are the companies with the strongest reason to localize: their costs are mostly licensing, their competition is piracy, and a $12.99 subscription is simply not a product in a country where that is a day's wage.
Productivity software and VPNs behave like global goods with a currency conversion. ExpressVPN's monthly plan sits between $14.48 and $15.86 everywhere; Notion Plus between $12.00 and $13.36; Grammarly Pro between $26.57 and $33.45. Google's 2 TB plan and Dropbox Plus vary by less than a factor of two, and most of that is VAT and rounding to a tidy local number.
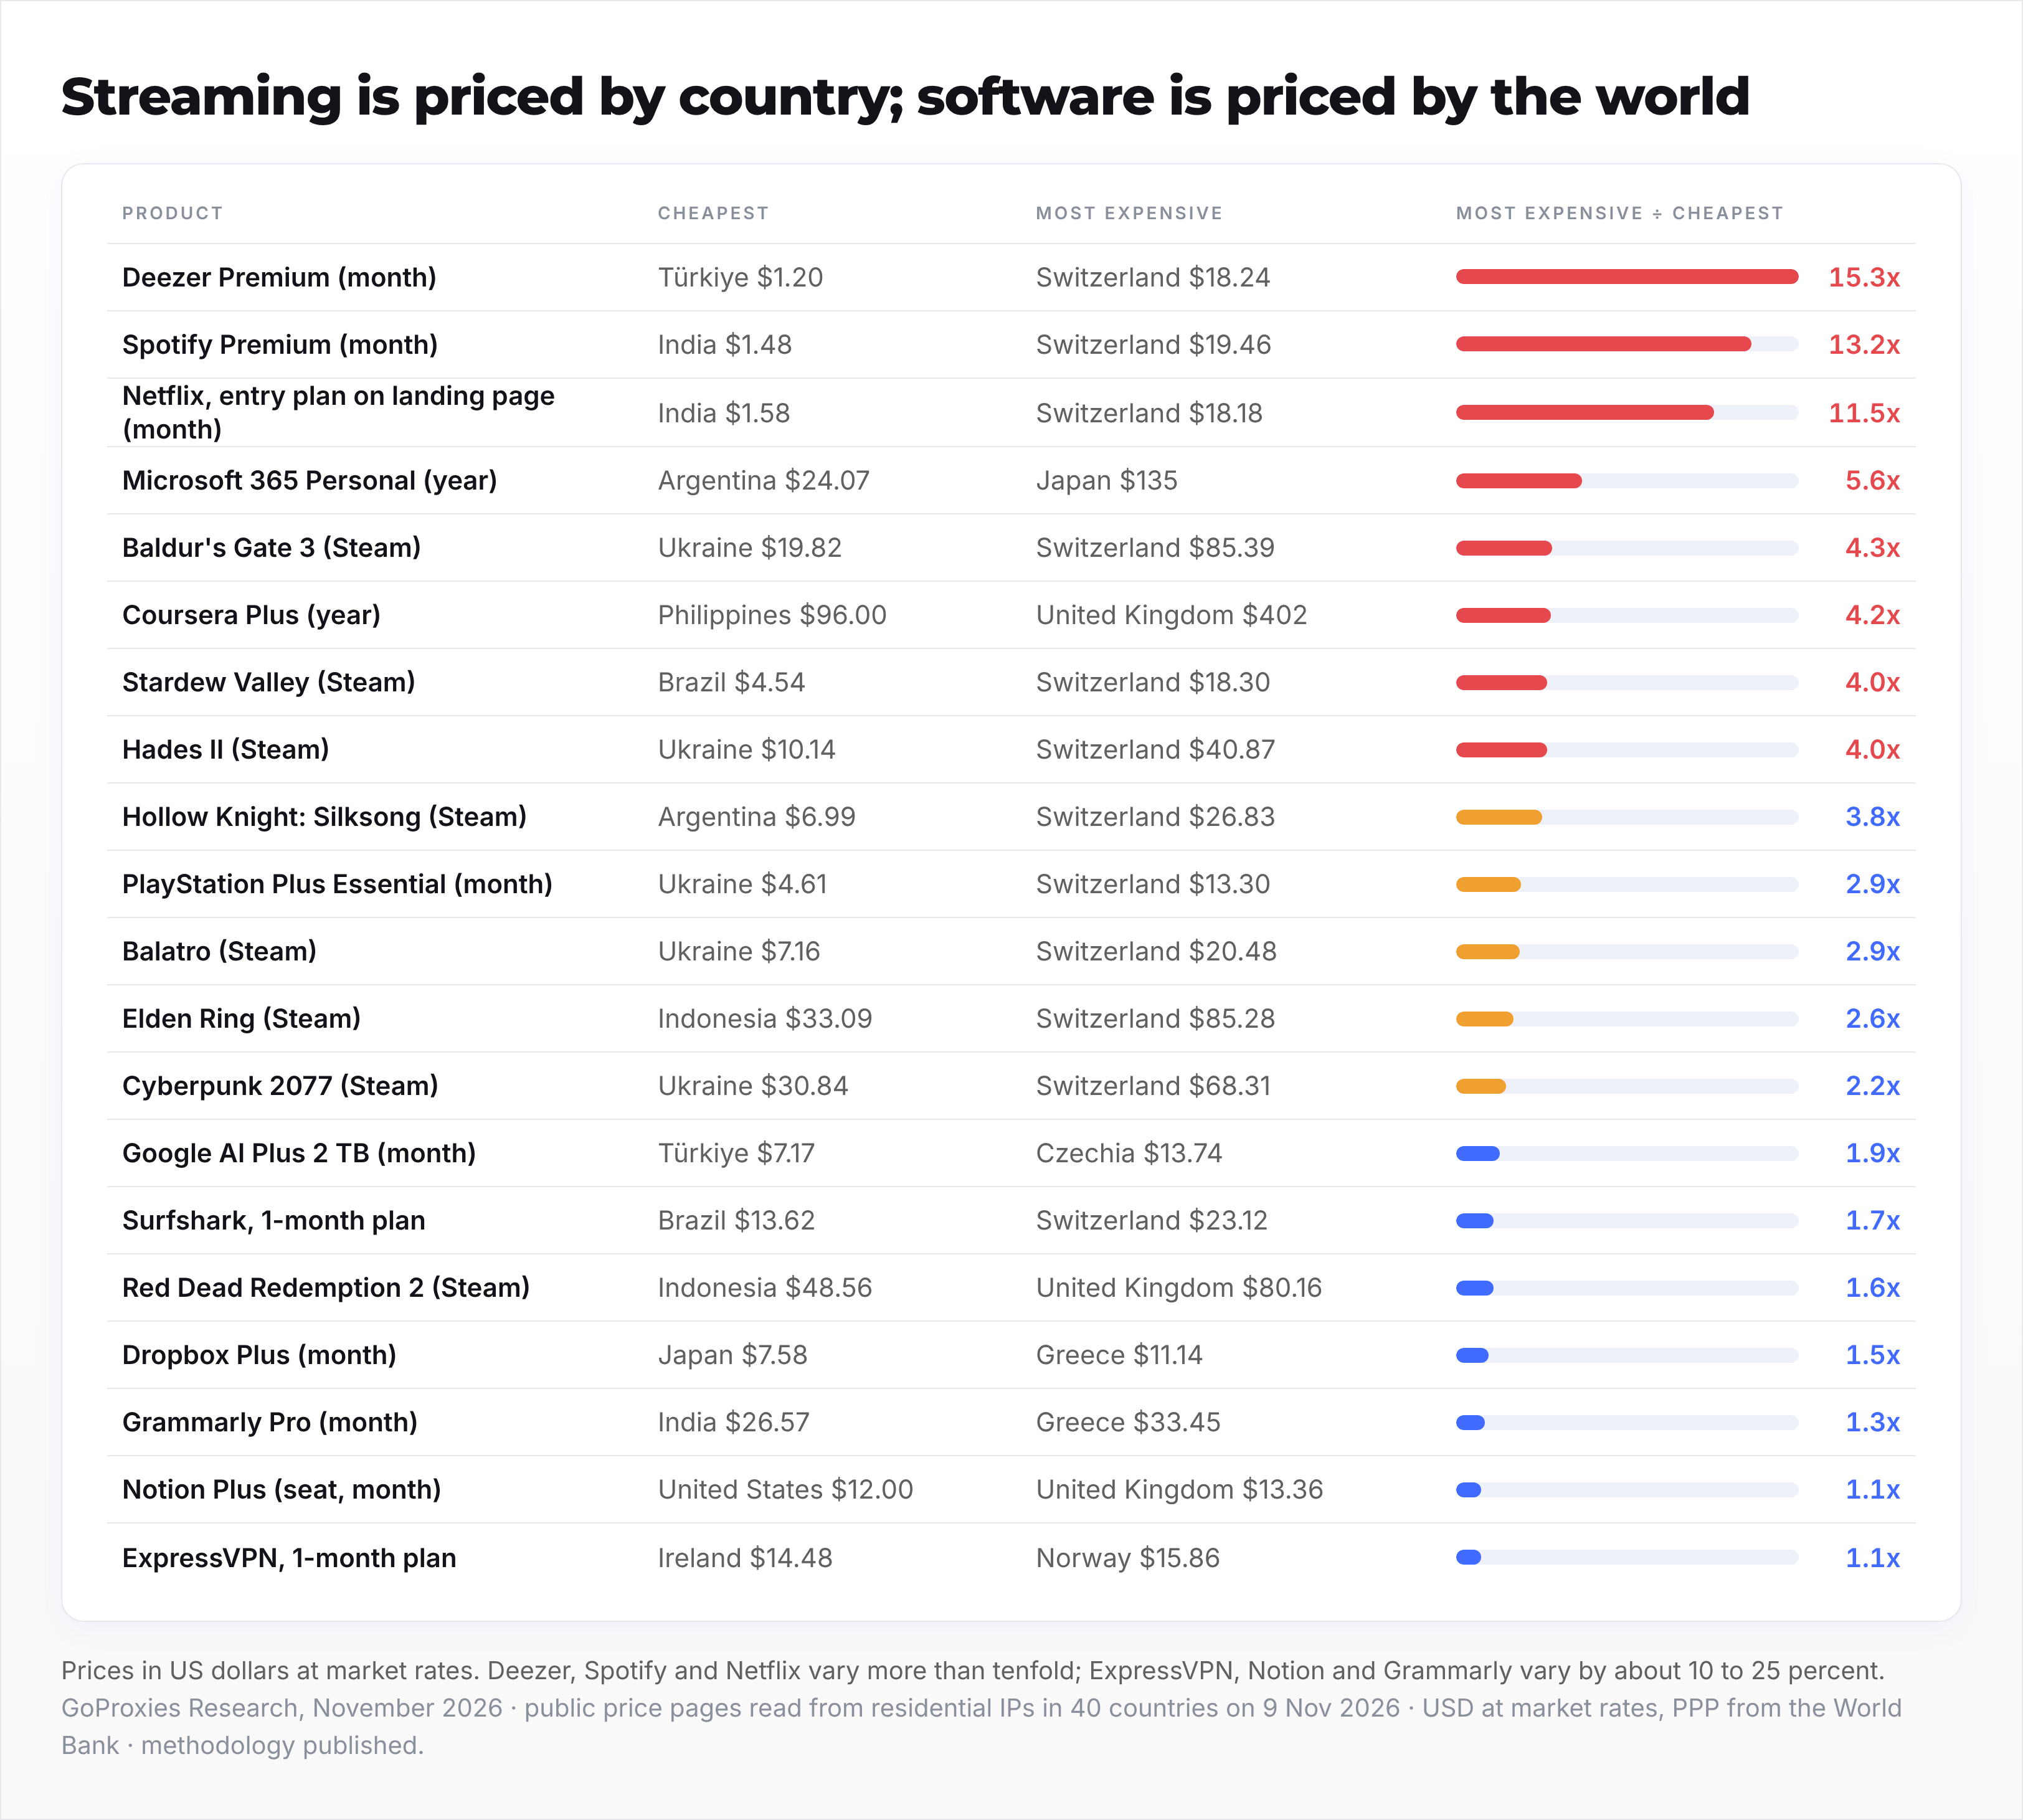
Two services break their own pattern. Microsoft 365 Personal costs $24.07 a year in Argentina and $135 in Japan, a 5.6-fold gap for a product that is otherwise priced like software. And Coursera Plus was running a promotion in 36 of 40 markets on the day we looked (the US price of $239 is a discount from $399); the United Kingdom, excluded from the offer, was the most expensive market at $402 a year.
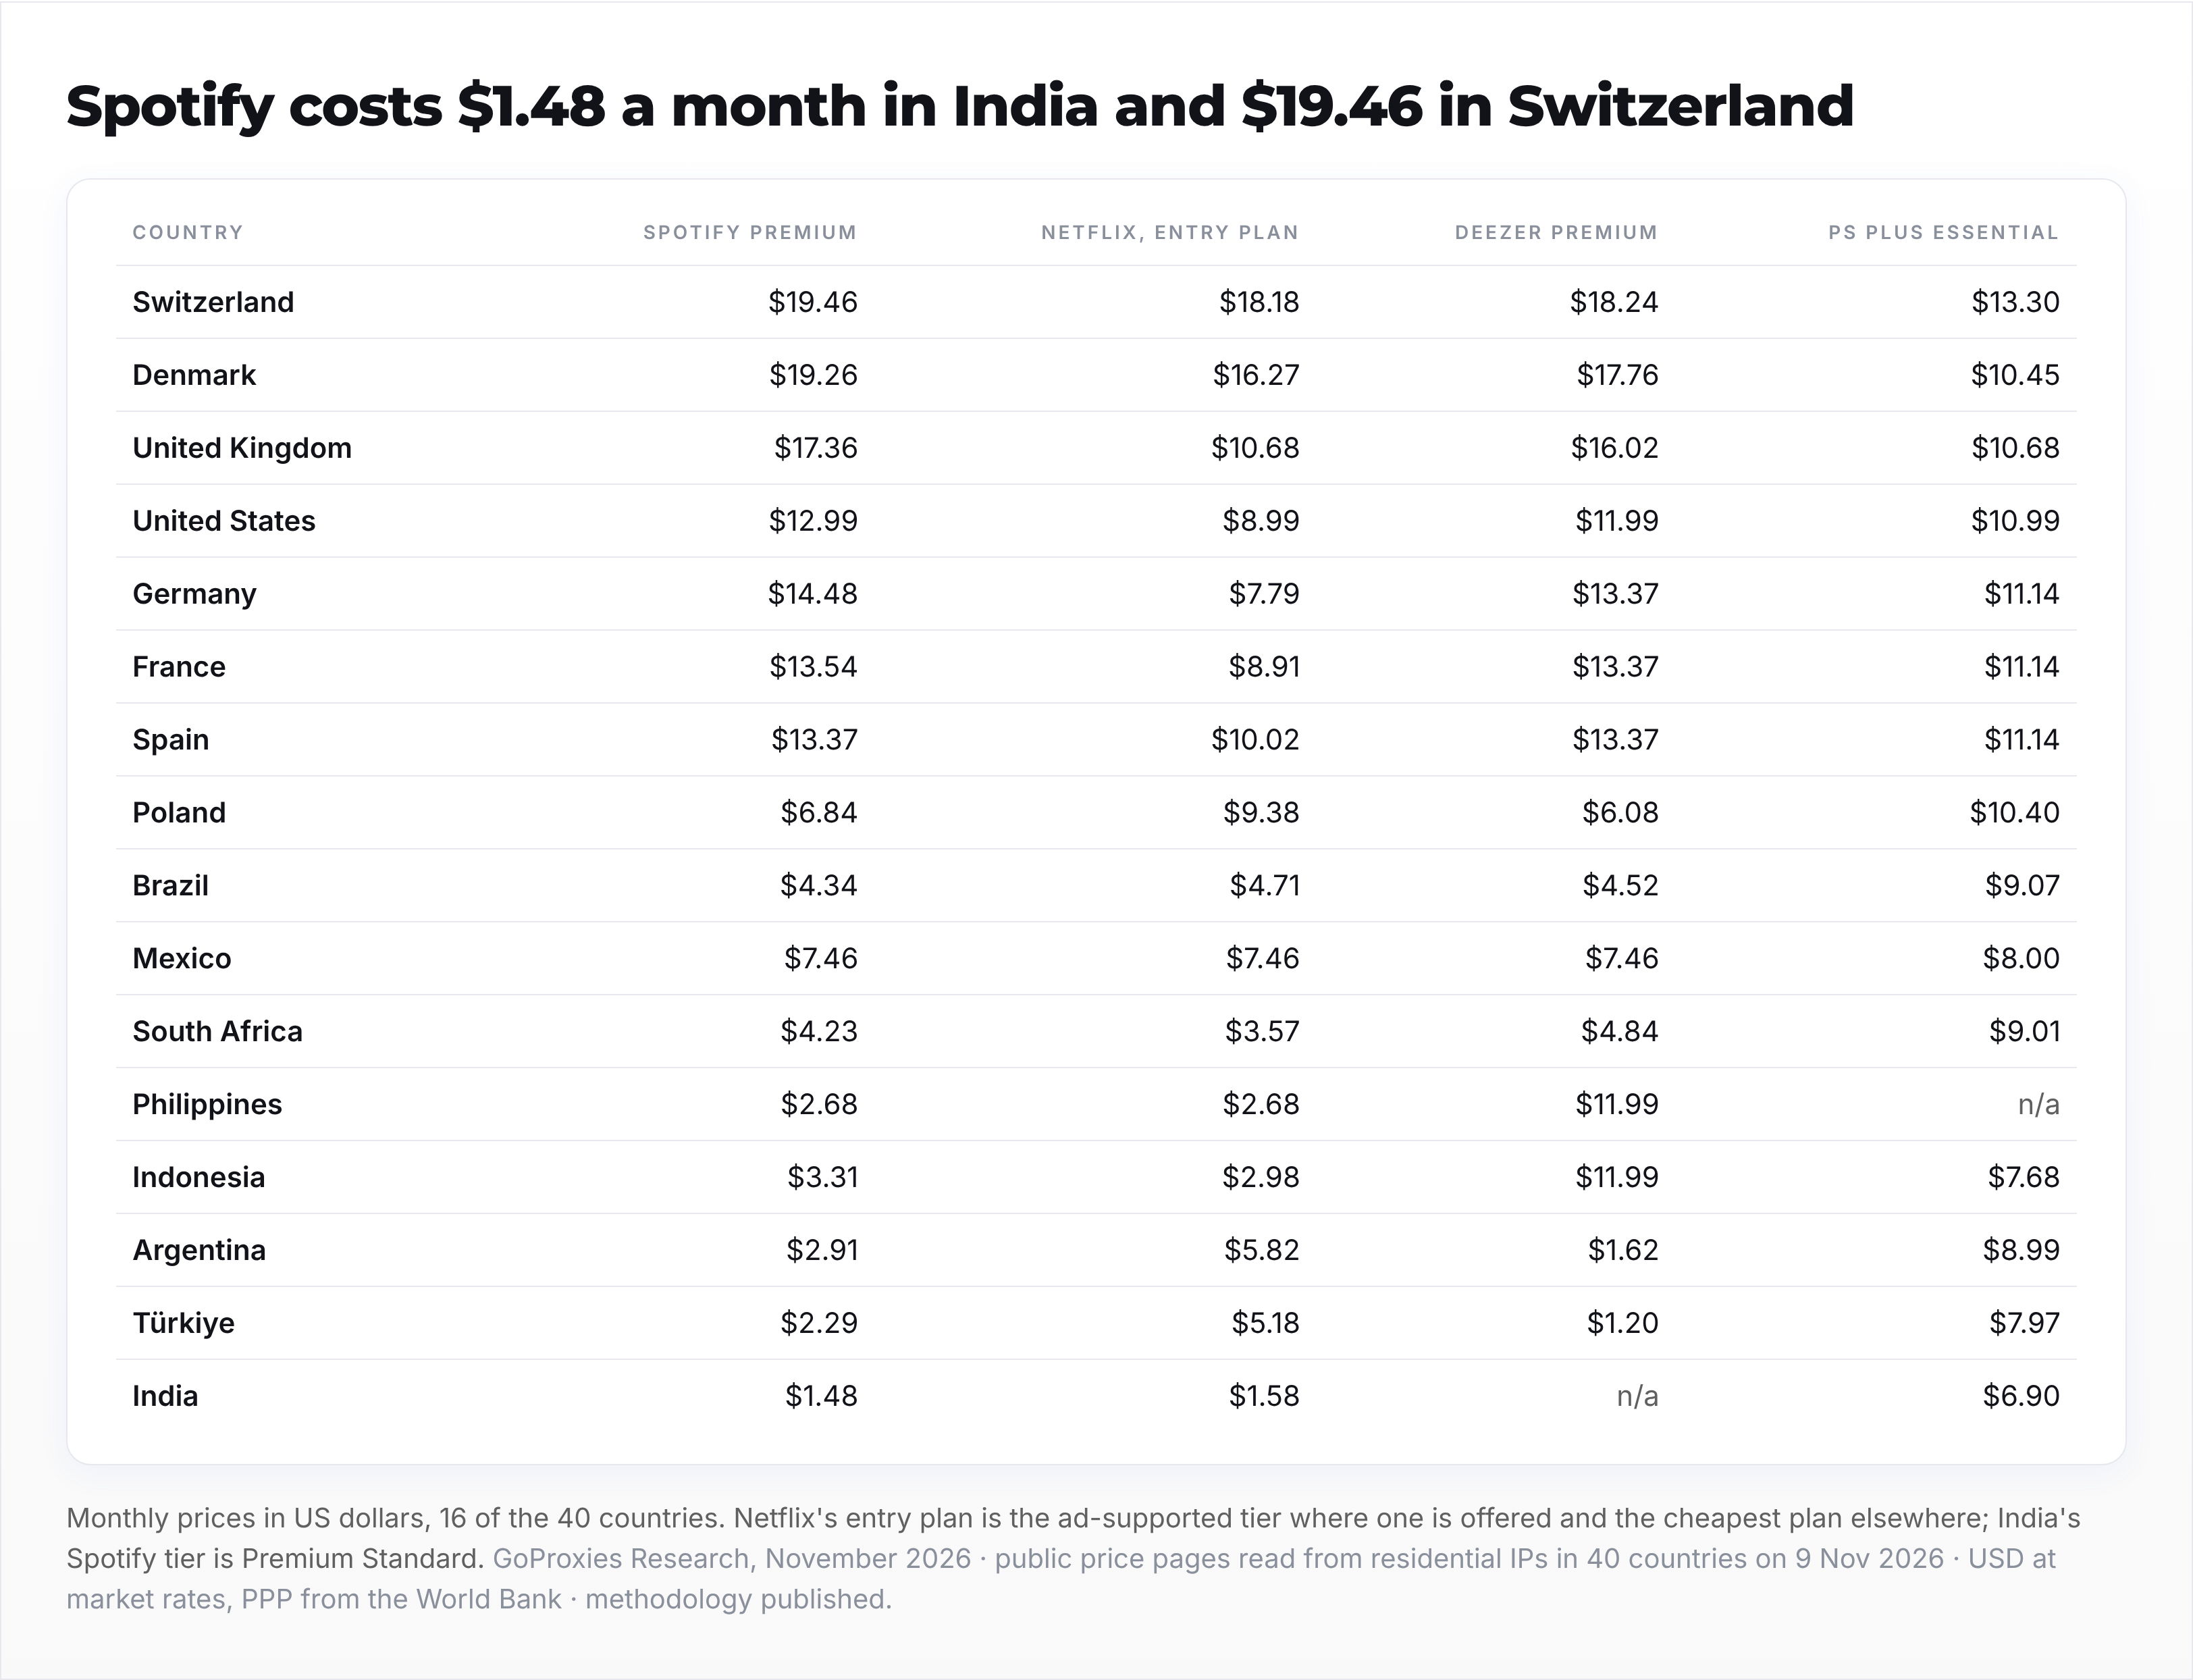
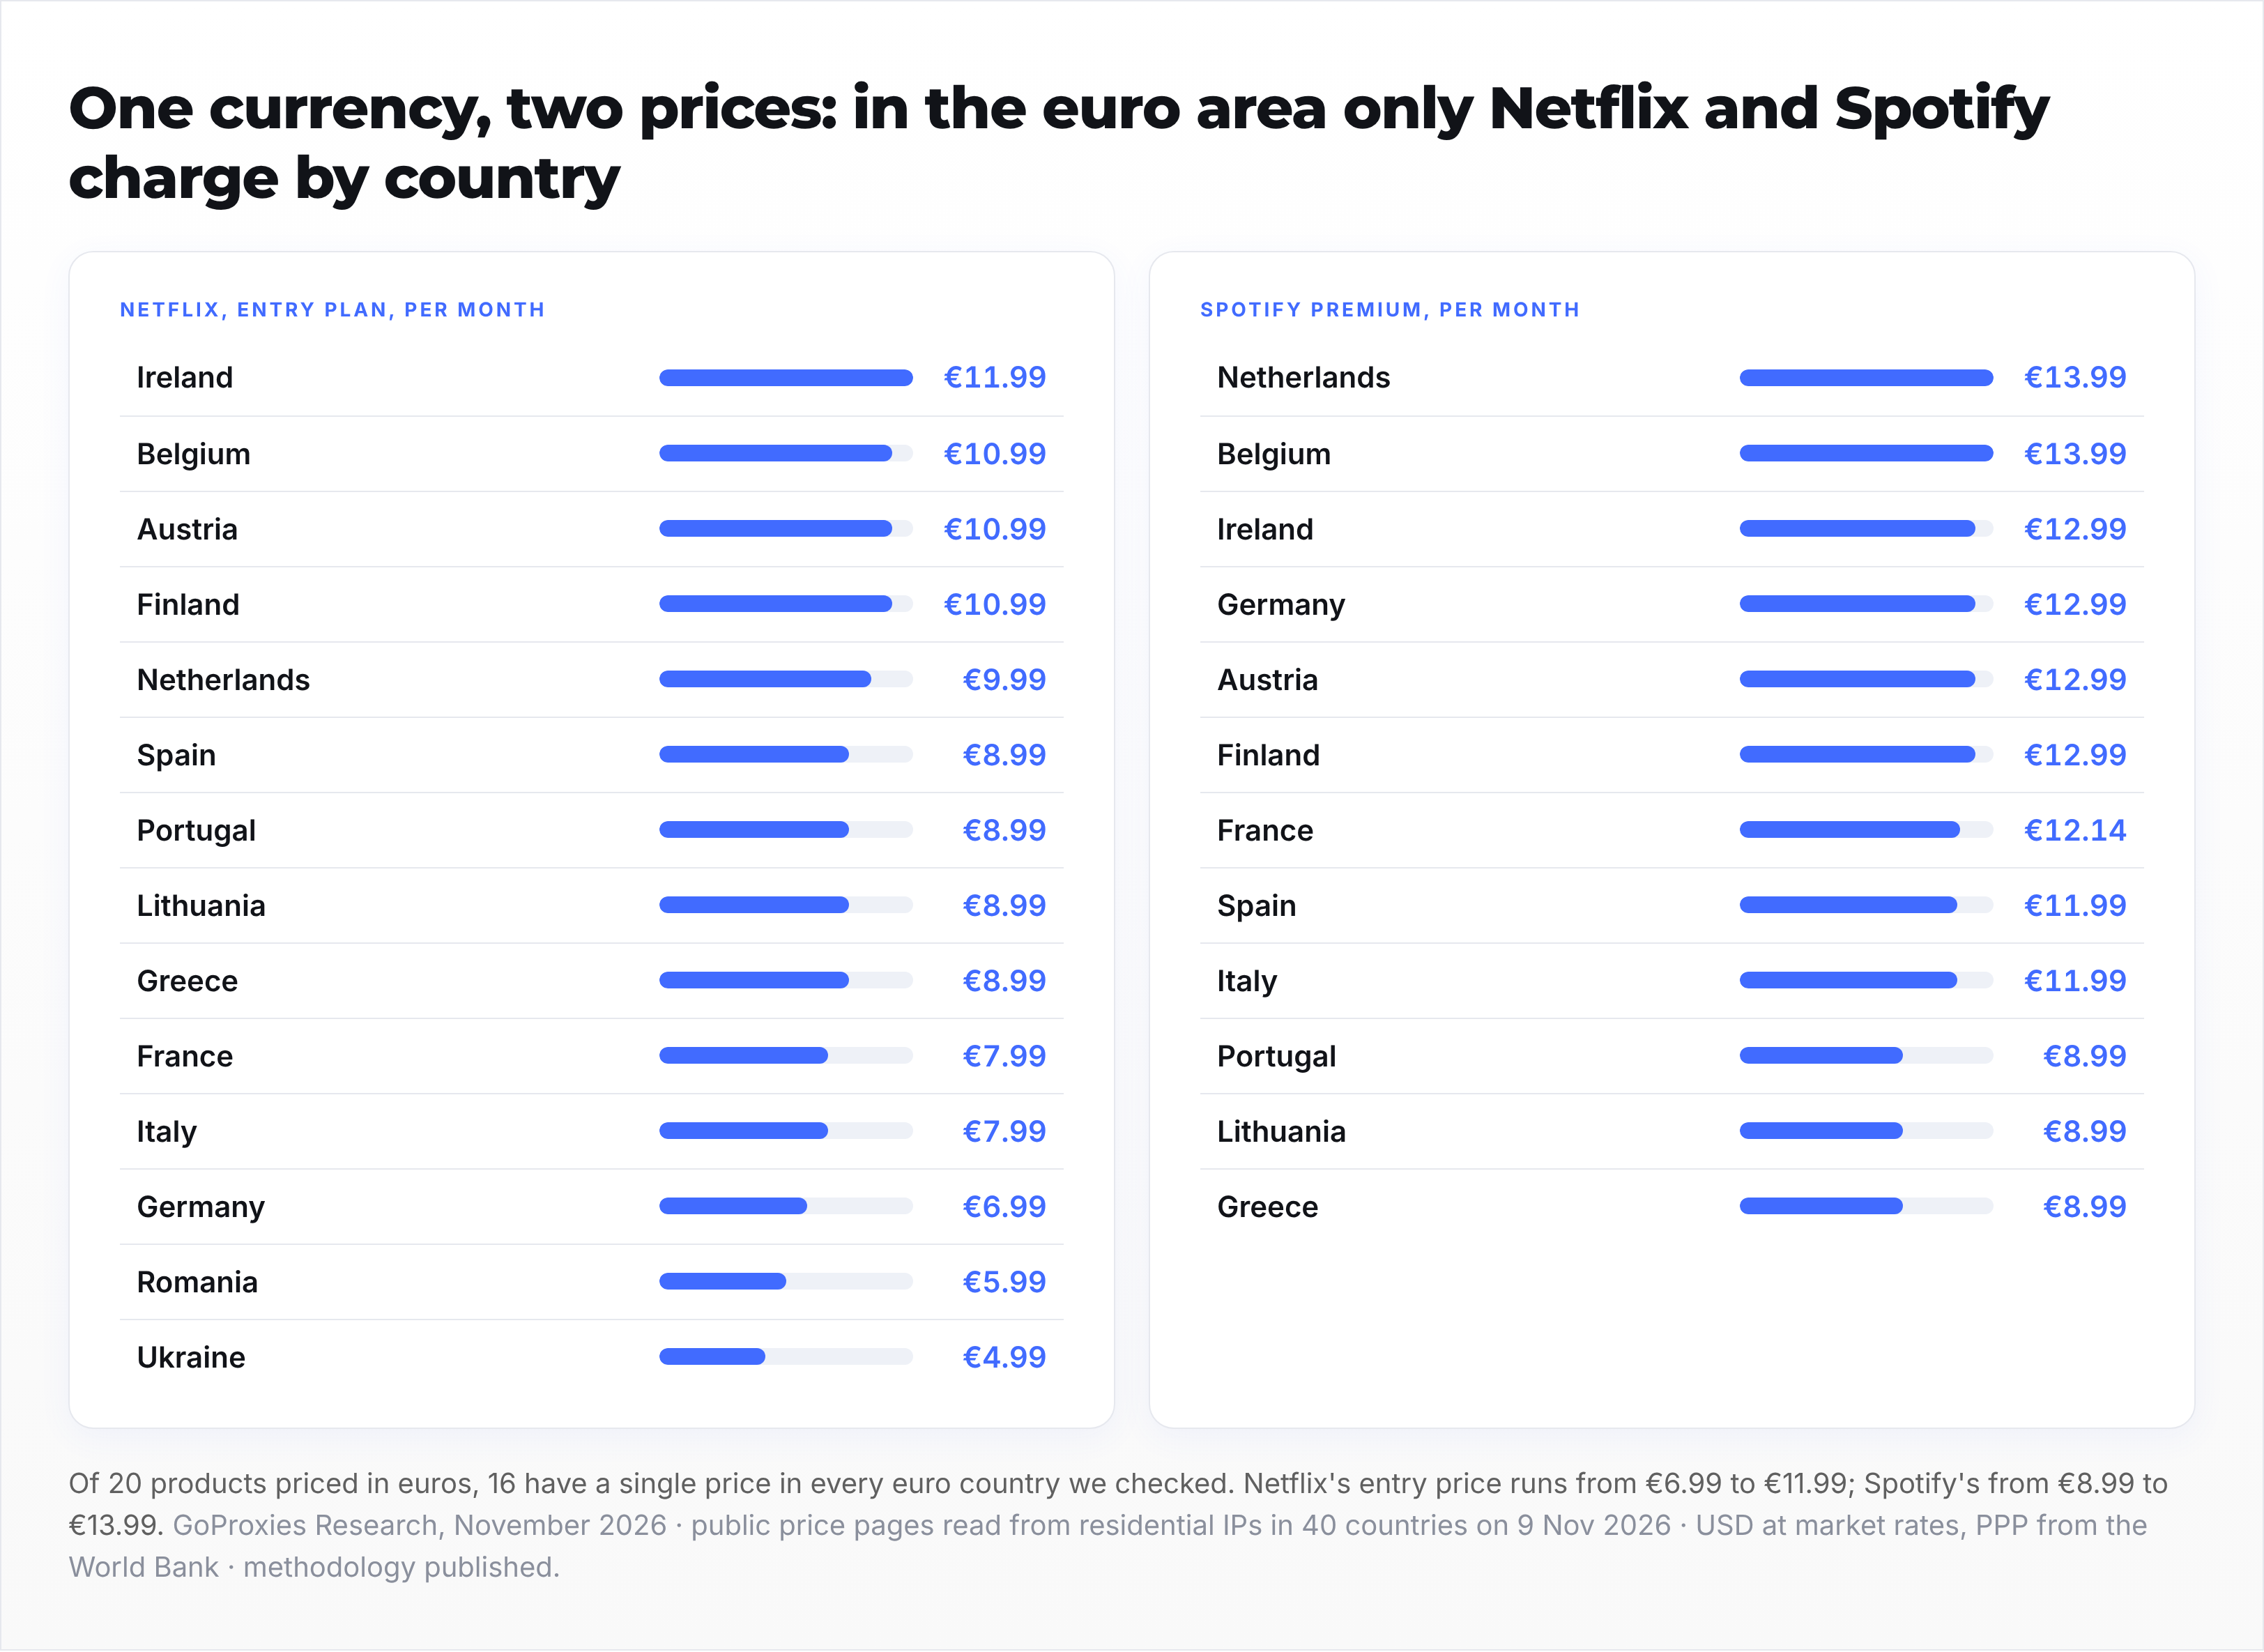
The euro area is the cleanest test of whether companies price by country or by currency, because the exchange rate is removed. Of 20 products priced in euros, 16 charge the same amount from Lisbon to Helsinki. The two exceptions are the two streaming giants.
Netflix's entry plan costs €6.99 in Germany and €11.99 in Ireland, partly because the ad-supported tier exists in some countries and not others. Spotify Premium costs €8.99 in Portugal and €13.99 in the Netherlands, with 5 different prices across the euro countries we checked.
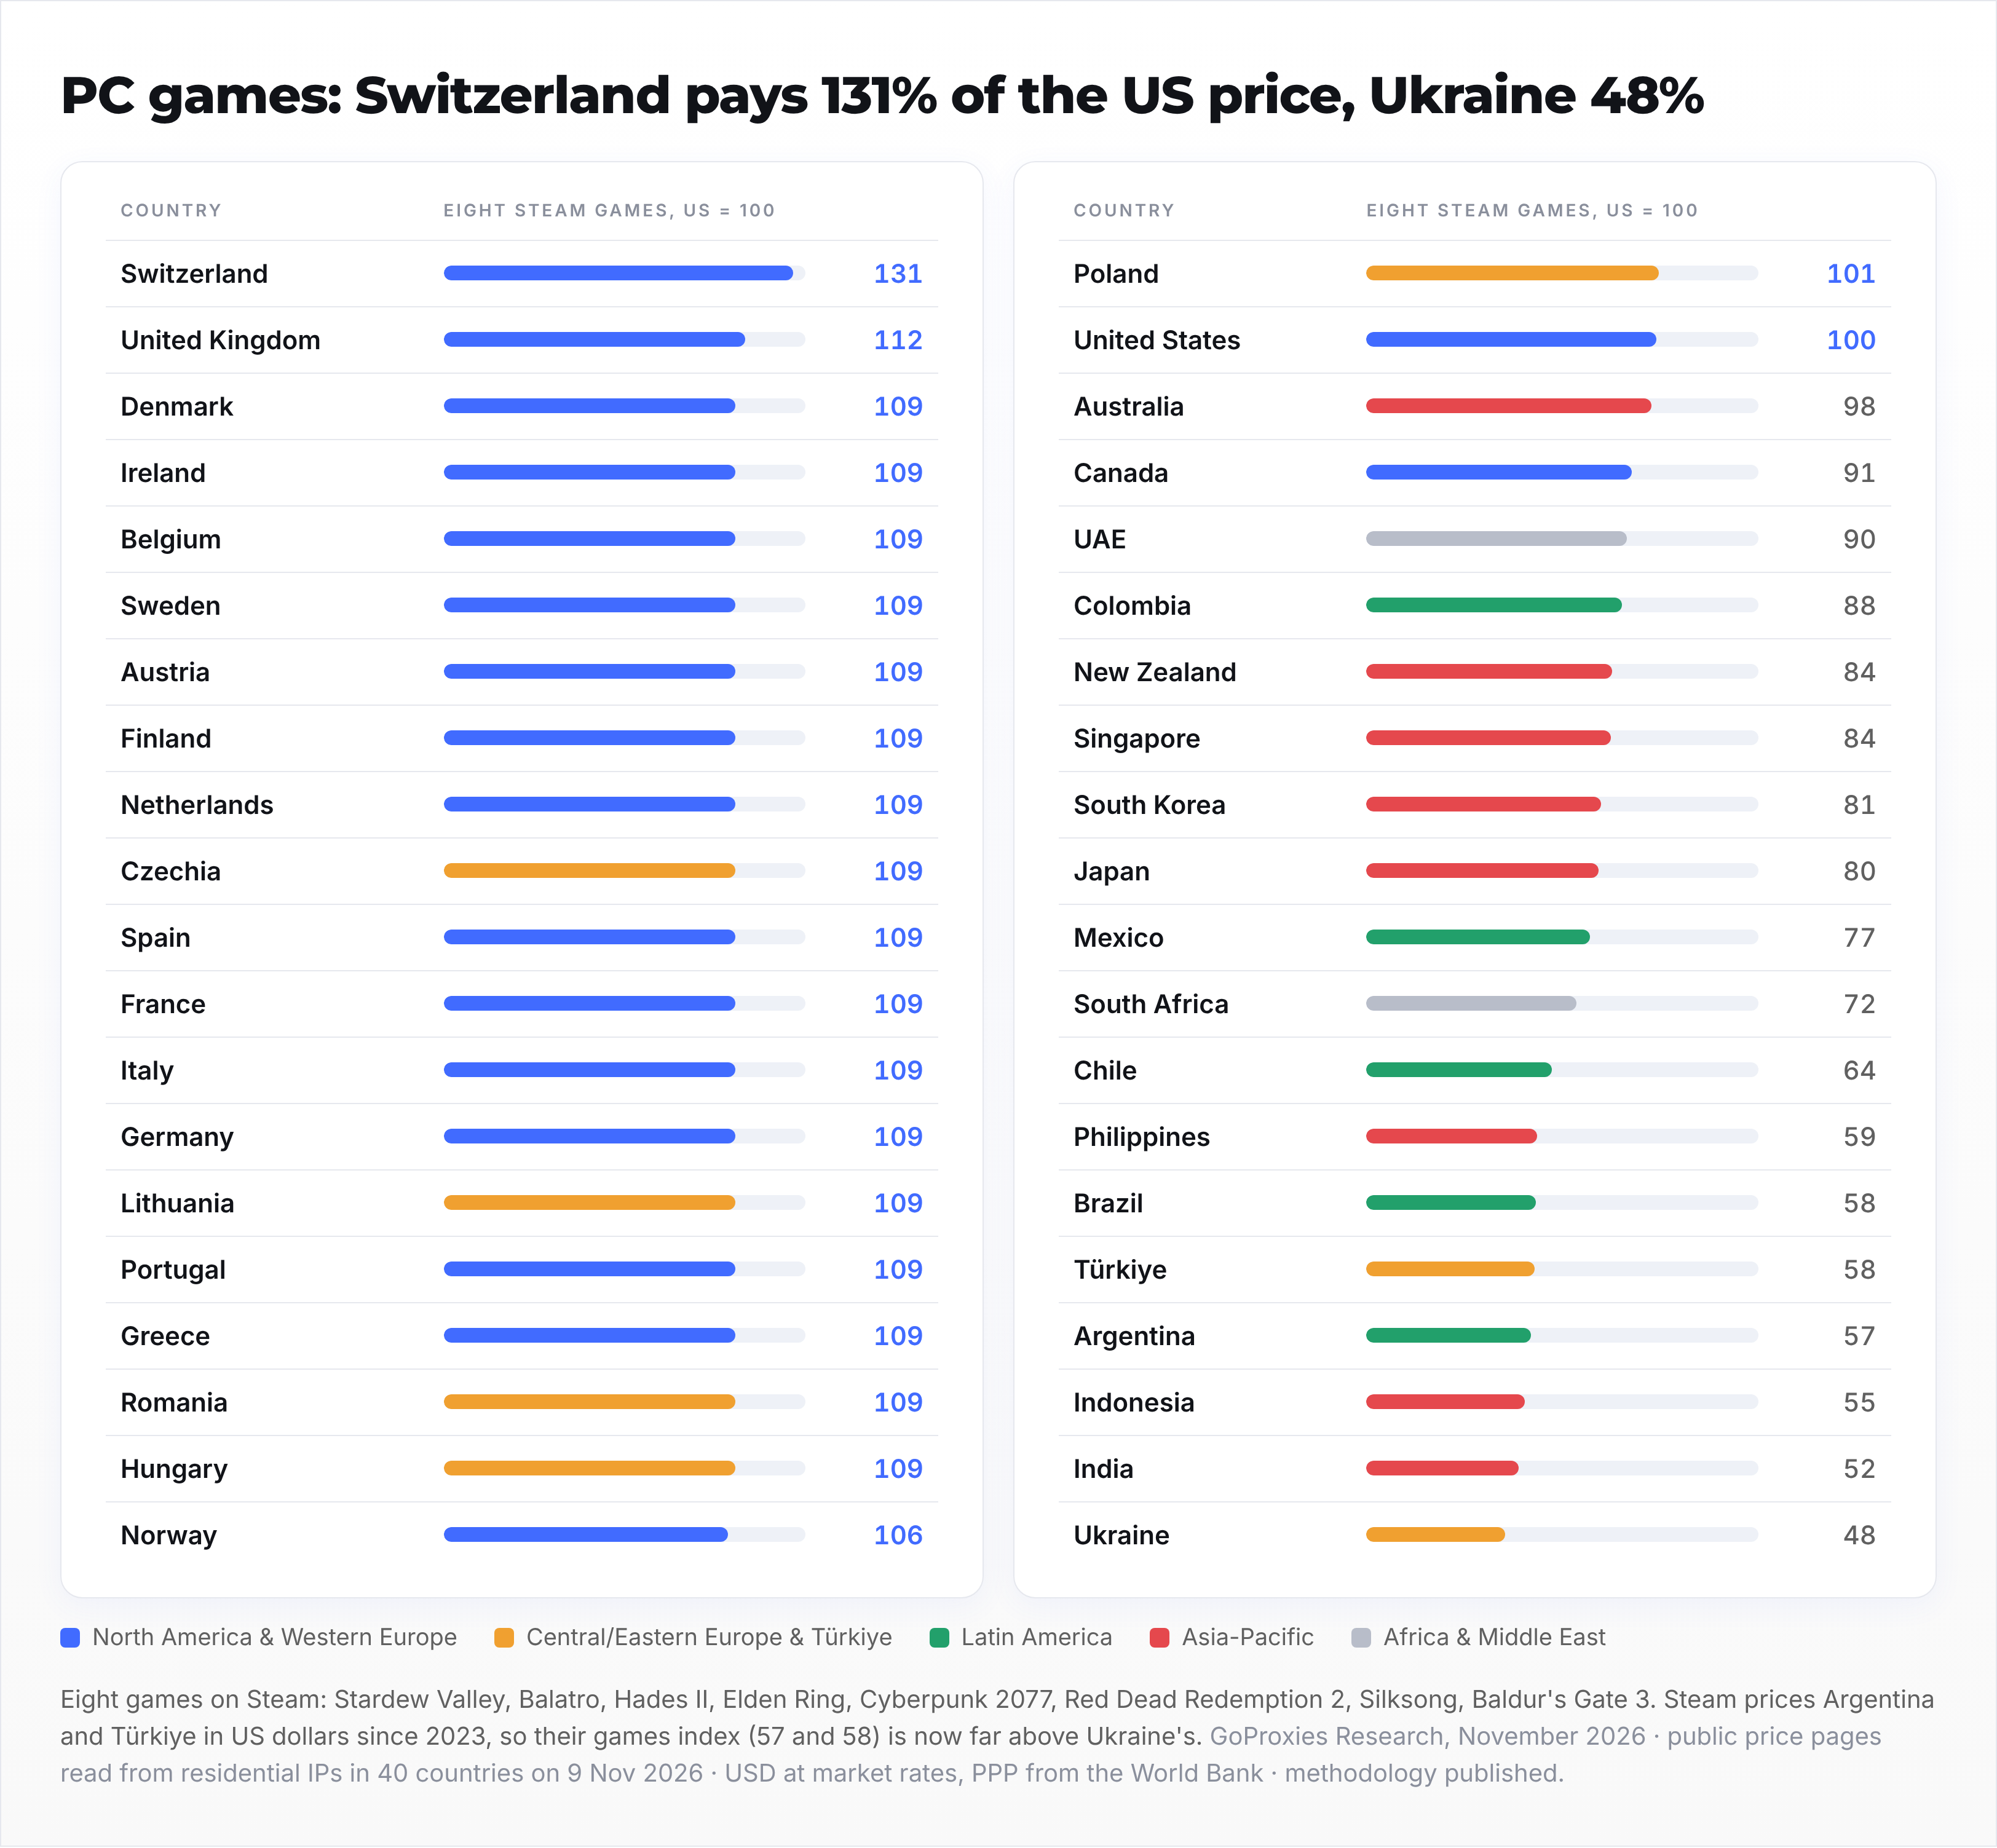
For years, the cheapest place on earth to buy a PC game was Argentina or Türkiye, and the trick of switching a Steam account's region there was an open secret. In 2023, Steam moved both countries to US-dollar pricing.
Our eight games show the result: Argentina sits at 57 on the games index and Türkiye at 58, while Ukraine, still priced in hryvnia, is the cheapest market at 48. Baldur's Gate 3 costs $19.82 in Ukraine, $34.99 in Argentina and $85.39 in Switzerland.
At the top, Switzerland (131) and the United Kingdom (112) pay more than Americans for every title, and the euro area pays a uniform 109: publishers set one euro price and let the exchange rate decide the rest.
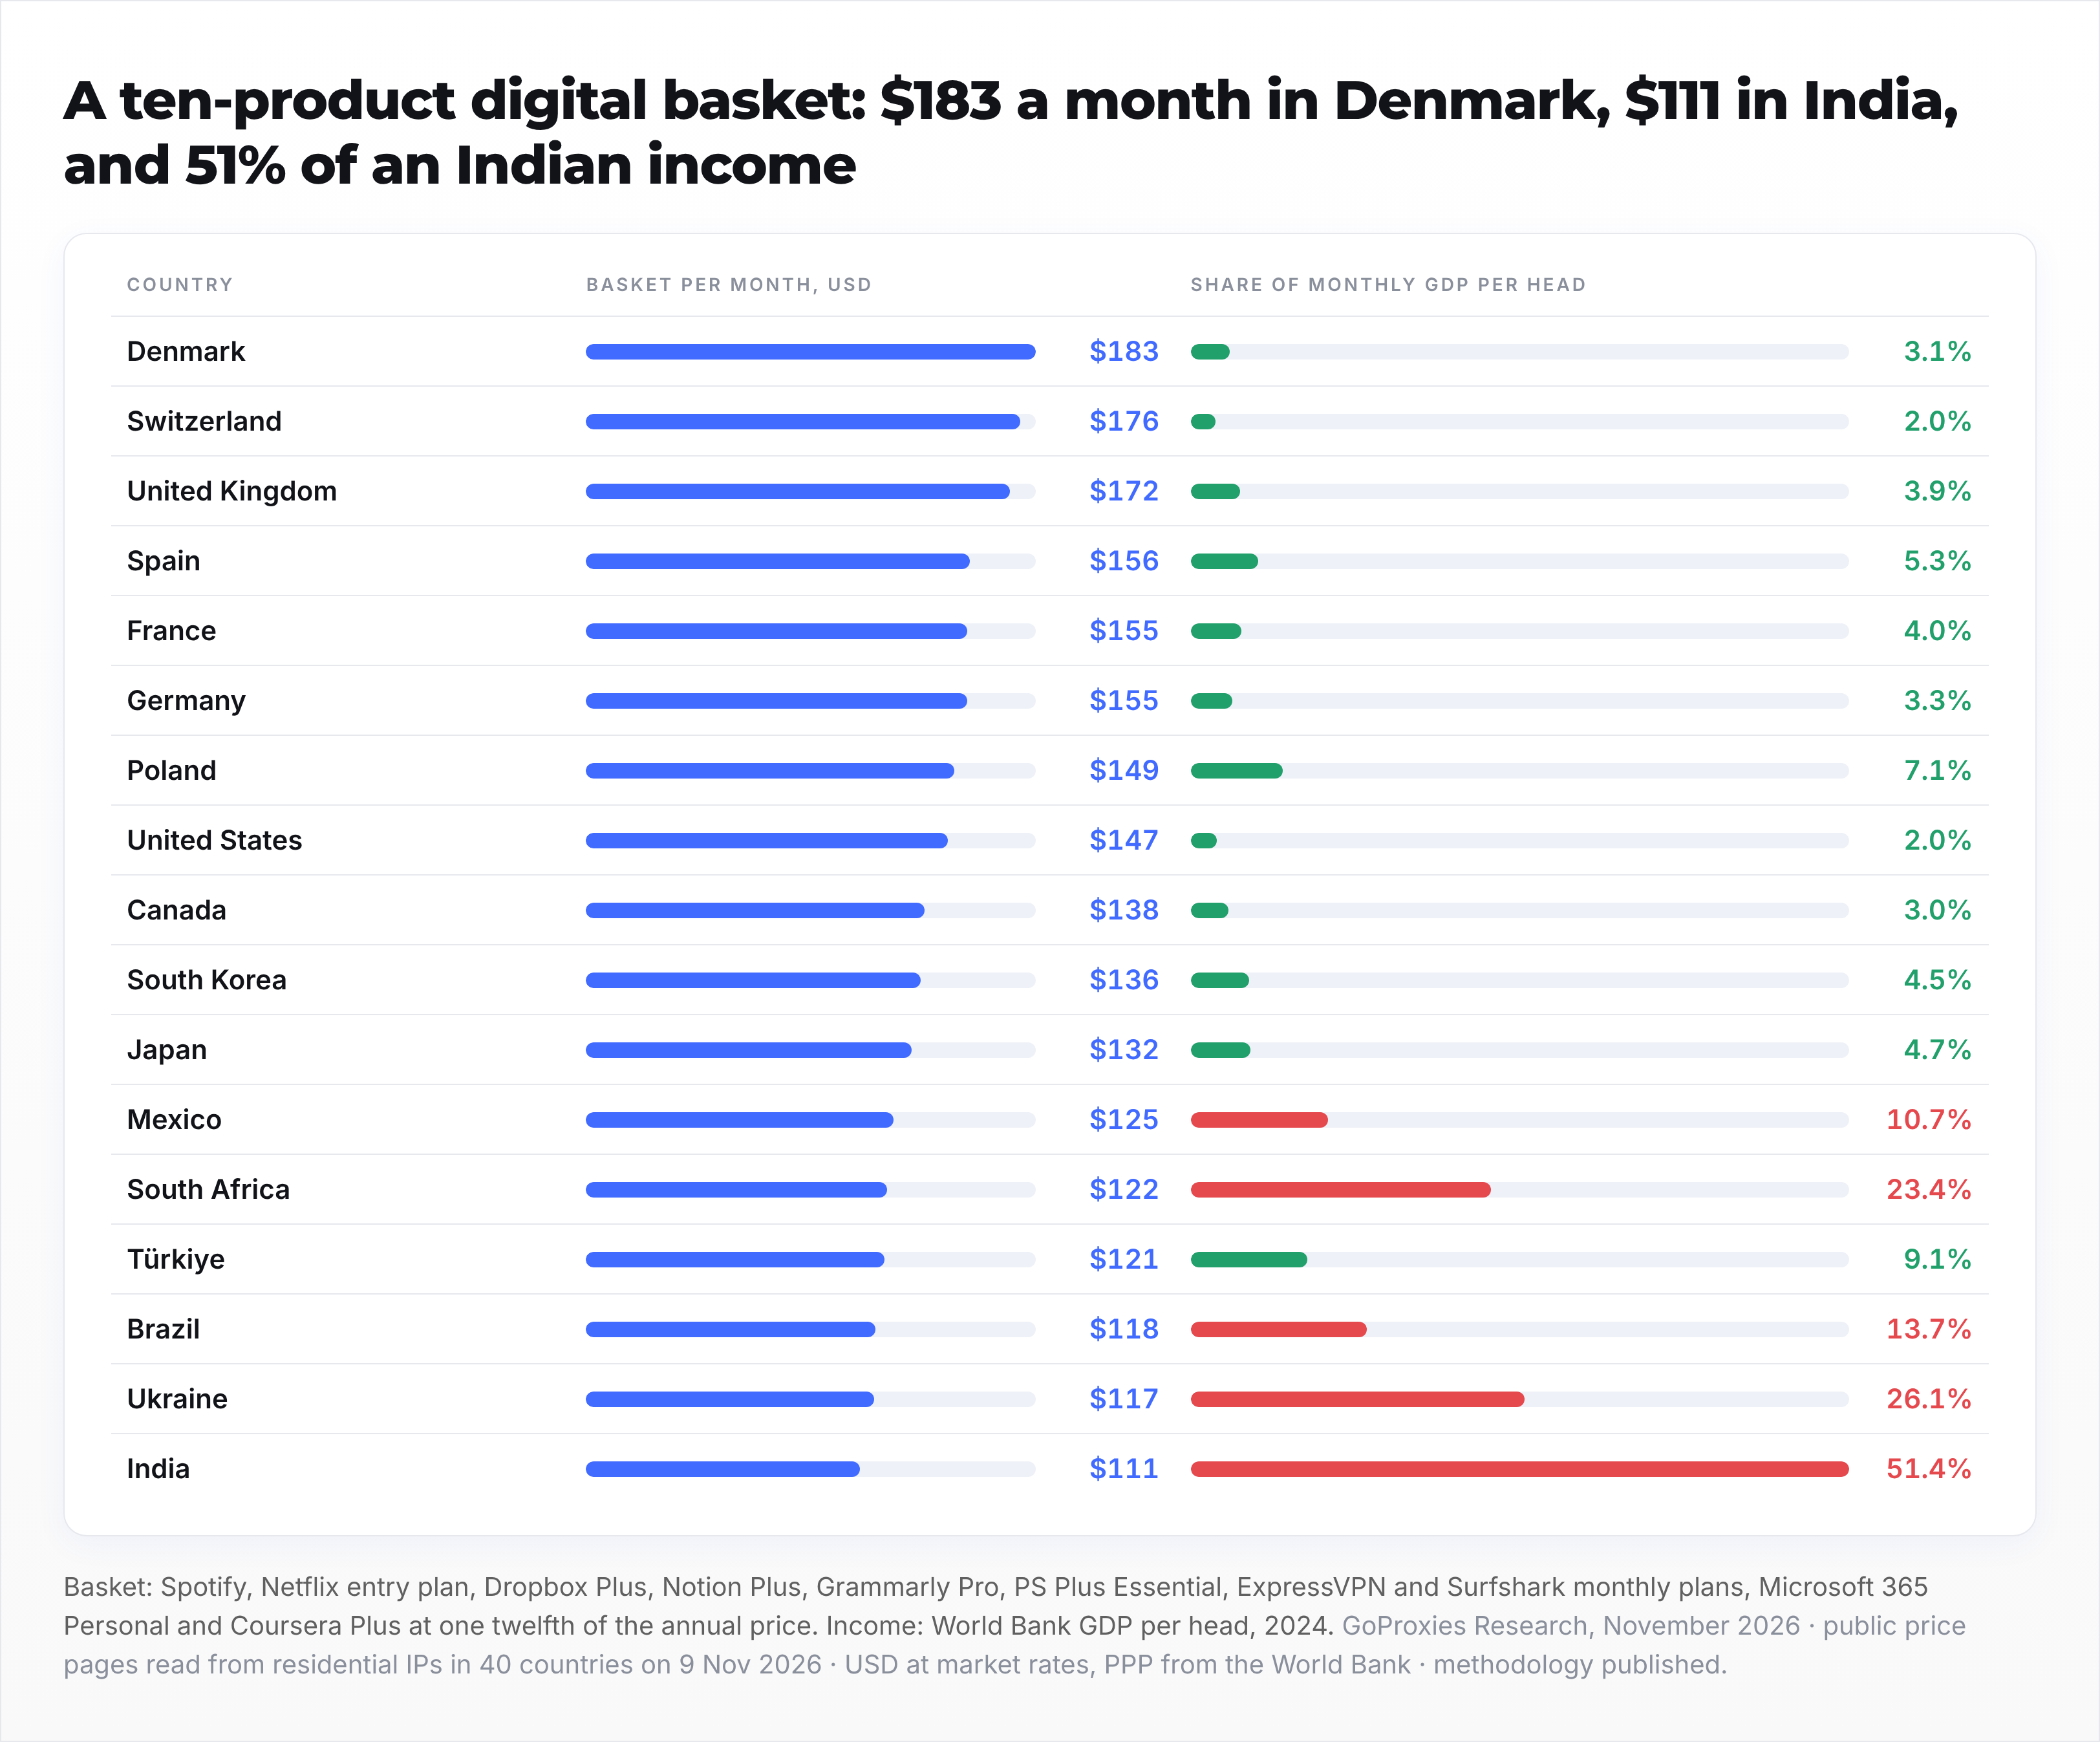
Add it up. A basket of ten everyday subscriptions (Spotify, Netflix, Dropbox, Notion, Grammarly, PlayStation Plus, two VPNs, Microsoft 365 and Coursera Plus, the annual ones divided by twelve) costs $183 a month in Denmark, $147 in the United States and $111 in India.
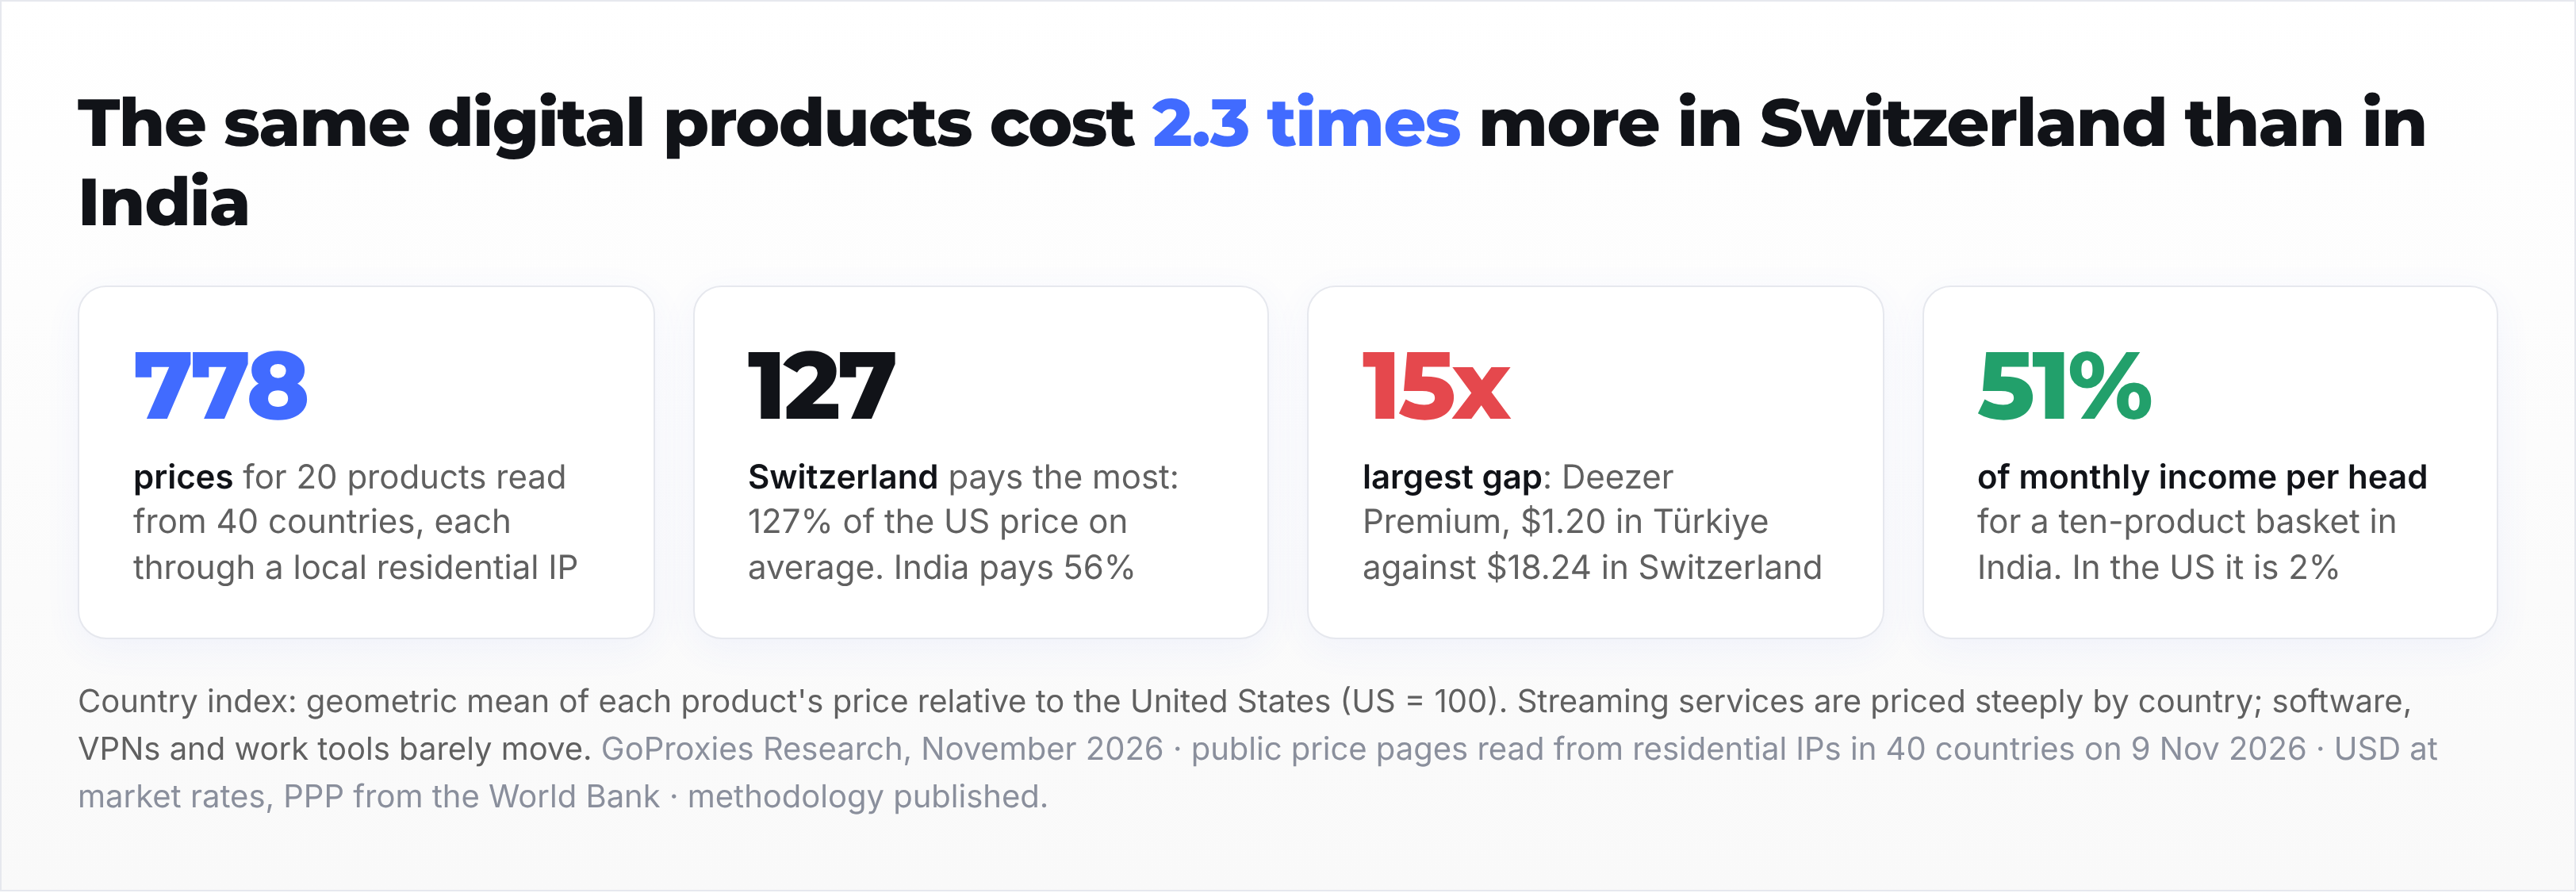
Measured against monthly GDP per head, that basket is 2% of an American's income, 3% of a German's, 7% of a Pole's, 14% of a Brazilian's and 51% of an Indian's. The discounts are real; they are also nowhere near large enough to make the products equally affordable.
Every one of these prices was decided by an IP address. The pages carry no login, no account history, and no cookies; the only signal was the network the request came from. That is what makes the gaps visible, and it is also why the gaps are invisible to ordinary users: nobody is ever shown the other price.
Companies defend regional pricing as fairness, charging less where incomes are lower, and the streaming data supports that story. The purchasing-power figures show how far it still has to go, and the euro-area figures show that for most software the fairness argument is not being made at all.
For anyone whose job is to see the web as other countries see it (price monitoring, ad verification, market research, SEO), the lesson is older than this study: there is no single internet, only the one your IP is allowed to see.
We selected 20 products with public price pages that respond to the visitor's location: 12 subscriptions and 8 PC games.
On 9th November 2026, we loaded each page once from a residential IP in each of 40 countries through the GoProxies network, recorded the headline consumer price shown, and checked that the page itself reported the intended country where it carries such a marker.
Prices were converted to US dollars at that day's exchange rates and to purchasing-power dollars with the World Bank's 2024 PPP conversion factors; incomes are World Bank GDP per head for 2024. The index is the geometric mean of a country's price ratios to the US across the products available there.
We read only public pages, once each, with no login, account, or purchase. Four products were dropped before analysis: two render prices only in the browser, one serves US prices to most of the world, and one hides behind a cookie-consent wall in the EU.
A Spotify subscription is the same product everywhere: the same catalog, the same app, the same servers. What changes is the price, and the only thing that decides which price you see is where your internet connection appears to be. We wanted to measure that gap properly, so on one day in November we opened the public price pages of 20 digital products from residential connections in 40 countries and recorded what a local shopper would see.
The result is an index of 778 prices. Converted to US dollars, Switzerland is the most expensive country for digital goods (127% of the US price on average) and India the cheapest (56%). But the dollar view flatters the discounts. Divide each price by what money actually buys in each country, and the order flips: Türkiye, India, and Romania carry the heaviest burden, at about two and a half times the US level, while the rich countries that pay the highest sticker prices are among the easiest places to afford them.

GoProxies Research Team is a group of analysts and writers focused on web data, online privacy, and proxy technology. They produce practical, research-backed content that helps readers understand digital trends, tools, and best practices.
The rich text element allows you to create and format headings, paragraphs, blockquotes, images, and video all in one place instead of having to add and format them individually. Just double-click and easily create content.
A rich text element can be used with static or dynamic content. For static content, just drop it into any page and begin editing. For dynamic content, add a rich text field to any collection and then connect a rich text element to that field in the settings panel. Voila!
Headings, paragraphs, blockquotes, figures, images, and figure captions can all be styled after a class is added to the rich text element using the "When inside of" nested selector system.


